




A covariance calculator helps measure how two numerical variables change together. It identifies whether two datasets tend to move in the same direction, move in opposite directions, or show little linear relationship. Covariance is widely used in statistics, finance, business analysis, economics, and scientific research.
Using a covariance calculator simplifies complex statistical calculations by automatically measuring the relationship between paired observations. However, understanding the formulas, calculation methods, and interpretation is essential for obtaining meaningful results.
This guide explains sample and population covariance, provides step-by-step examples, and shows how to calculate covariance using Excel, Google Sheets, and Python. It also explores covariance in investment portfolios and explains how it differs from correlation.
Covariance Calculator: How to Calculate Covariance
A covariance calculator processes two numerical datasets and measures how their corresponding observations vary together.
To use the tool, follow these steps:
- Enter Dataset X: Add your first set of numerical values.
- Enter Dataset Y: Provide the corresponding values for the second variable.
- Check the data: Ensure both datasets contain matching observations.
- Calculate covariance: Obtain sample and population covariance values.
- Interpret the output: Examine the covariance sign, correlation, and relationship between variables.
For example, consider these datasets:
- Dataset X: 2, 4, 6, 8
- Dataset Y: 1, 3, 2, 5
The expected results are:
| Calculation | Result |
| Paired observations | 4 |
| Mean of X | 5 |
| Mean of Y | 2.75 |
| Sample covariance | 3.6667 |
| Population covariance | 2.75 |
| Pearson correlation | 0.8315 |
Both covariance values are positive, indicating that the two variables tend to move together.
The difference between sample and population covariance comes from the denominator used in each formula.
What Is Covariance in Statistics?
Covariance is a statistical measure describing how two variables vary together relative to their averages. It compares corresponding observations and determines whether values above or below one variable’s mean tend to occur alongside values above or below another variable’s mean.
For example, a business might compare monthly advertising spending with sales revenue. If higher advertising expenditure generally coincides with increased revenue, the variables may have positive covariance. Similarly, investors use covariance to analyze the historical relationship between different assets’ returns.
What Does Covariance Tell You?
Covariance has three main interpretations:
- Positive covariance: Both variables generally move in the same direction.
- Negative covariance: The variables generally move in opposite directions.
- Zero covariance: No linear co-movement is measured.
Unlike correlation, covariance has no fixed numerical range. Its magnitude depends on the measurement units and variability of the datasets.
Importantly, covariance measures association rather than causation.
Covariance Formula: Sample vs. Population
There are two primary covariance formulas. Choosing the correct one depends on whether the observations represent a sample or an entire population.
Sample Covariance Formula
Sample covariance is appropriate when observations represent a subset of a larger population.
Formula:
sₓᵧ = Σ[(xᵢ − x̄)(yᵢ − ȳ)] / (n − 1)
Where:
- sₓᵧ: Sample covariance
- xᵢ and yᵢ: Corresponding observations
- x̄ and ȳ: Sample means
- n: Number of paired observations
- Σ: Sum of the deviation products
Sample covariance divides the summed deviation products by n − 1.
Under standard independent-sampling assumptions, this adjustment provides an unbiased estimator of population covariance.
Population Covariance Formula
Population covariance is used when the dataset contains every observation in the population being described.
Formula:
σₓᵧ = Σ[(xᵢ − μₓ)(yᵢ − μᵧ)] / N
Where:
- σₓᵧ: Population covariance
- μₓ and μᵧ: Population means
- N: Total number of paired observations
Population covariance divides the total deviation products by N.
Sample Covariance vs. Population Covariance
| Feature | Sample Covariance | Population Covariance |
| Data | Sample observations | Entire population |
| Denominator | n − 1 | N |
| Minimum observations | 2 pairs | 1 pair |
| Excel function | COVARIANCE.S | COVARIANCE.P |
| Purpose | Estimate population covariance | Describe population covariance |
Choose sample covariance when estimating a relationship from sampled data. Use population covariance when describing a complete, clearly defined population.
How to Calculate Covariance Manually: Step-by-Step Example
Although a covariance calculator performs calculations automatically, understanding the manual process helps verify results and recognize potential errors.
Consider:
X = 2, 4, 6, 8
Y = 1, 3, 2, 5
Step 1: Calculate the Mean
First, find the average of X.
Mean X = (2 + 4 + 6 + 8) / 4 = 5
Next, calculate the average of Y.
Mean Y = (1 + 3 + 2 + 5) / 4 = 2.75
Step 2: Calculate Deviations
Subtract the corresponding mean from each observation.
X deviations: −3, −1, 1, 3
Y deviations: −1.75, 0.25, −0.75, 2.25
Step 3: Multiply the Paired Deviations
| X | Y | X − 5 | Y − 2.75 | Product |
| 2 | 1 | −3 | −1.75 | 5.25 |
| 4 | 3 | −1 | 0.25 | −0.25 |
| 6 | 2 | 1 | −0.75 | −0.75 |
| 8 | 5 | 3 | 2.25 | 6.75 |
| Total | 11 |
The sum of the deviation products is 11.
Step 4: Calculate Sample Covariance
Sample covariance = 11 / (4 − 1)
= 11 / 3
Sample covariance = 3.6667
Step 5: Calculate Population Covariance
Population covariance = 11 / 4
Population covariance = 2.75
Both results indicate positive covariance. The difference occurs because sample covariance divides by n − 1, while population covariance divides by n.
Shortcut Formula for Calculating Covariance
For larger datasets, the computational formula provides an alternative to calculating every deviation individually.
Sample covariance shortcut:
sₓᵧ = [Σxy − (Σx × Σy)/n] / (n − 1)
Using the previous datasets:
- Σx = 20
- Σy = 11
- Σxy = 66
- n = 4
Sample covariance = [66 − (20 × 11)/4] / 3
= (66 − 55) / 3
Sample covariance = 3.6667
This confirms the result obtained using the standard formula.
For large datasets containing very large numbers with small differences, numerical software may use more stable calculation methods.
How to Interpret Positive, Negative, and Zero Covariance
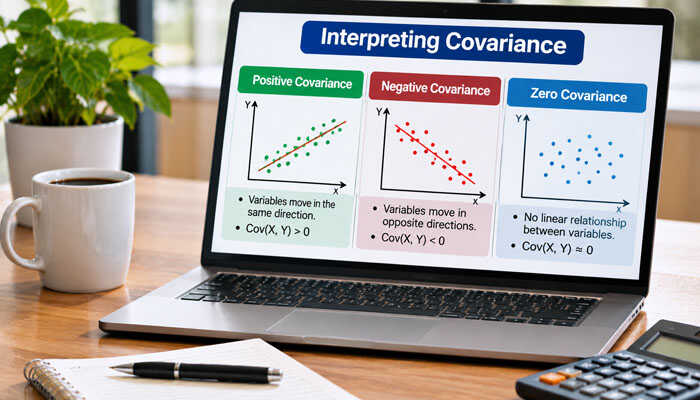
Understanding the sign of covariance is essential for interpreting a statistical relationship.
Positive Covariance
Positive covariance occurs when two variables generally move together relative to their averages. For example, a retailer may find that higher advertising expenditure tends to coincide with higher monthly sales.
However, this does not establish that advertising directly caused the sales increase.
Negative Covariance Example
Negative covariance indicates that two variables generally move in opposite directions.
Consider:
X = 1, 2, 3, 4
Y = 8, 6, 4, 2
The mean of X is 2.5, while the mean of Y is 5.
| X | Y | Deviation Product |
| 1 | 8 | −4.5 |
| 2 | 6 | −0.5 |
| 3 | 4 | −0.5 |
| 4 | 2 | −4.5 |
| Total | −10 |
Sample covariance = −10 / 3 = −3.3333
Population covariance = −10 / 4 = −2.5
The negative values indicate opposite-direction movement.
The correlation for this example is −1 because the observations follow a perfect negative linear relationship.
Can Covariance Be Zero When Variables Are Related?
Yes. Zero covariance does not necessarily indicate independence.
Consider:
- X = −2, −1, 0, 1, 2
- Y = 4, 1, 0, 1, 4
Every Y value equals X squared, demonstrating a nonlinear relationship. Nevertheless, the covariance equals zero because the positive and negative deviation products cancel. A scatter plot can help reveal relationships that covariance alone may overlook.
Covariance vs. Correlation: What’s the Difference?
Covariance measures how variables vary together, while correlation measures the standardized strength and direction of their linear association.
| Feature | Covariance | Correlation |
| Main purpose | Joint variation | Linear relationship |
| Range | Unbounded | −1 to +1 |
| Units | Product of variable units | Unitless |
| Strength comparison | Scale-dependent | Standardized |
| Common application | Portfolio risk | Relationship analysis |
Correlation Formula
The Pearson correlation coefficient is:
r = Cov(X,Y) / [SD(X) × SD(Y)]
The covariance and standard deviations must use consistent sample or population conventions.
Using the original example:
- Sample covariance = 3.6667
- Standard deviation of X ≈ 2.5820
- Standard deviation of Y ≈ 1.7078
Correlation ≈ 3.6667 / (2.5820 × 1.7078)
Correlation ≈ 0.8315
This indicates a relatively strong positive linear association among the four observations.
For comparing relationships across different measurement scales, correlation is generally more useful.
For calculating portfolio variance, covariance is particularly important.
How to Calculate Covariance in Excel
Microsoft Excel provides built-in functions for calculating sample and population covariance.
Enter the observations into two columns.
| Row | Column A | Column B |
| 2 | 2 | 1 |
| 3 | 4 | 3 |
| 4 | 6 | 2 |
| 5 | 8 | 5 |
Excel Covariance Formulas
| Calculation | Formula | Result |
| Sample covariance | =COVARIANCE.S(A2:A5,B2:B5) | 3.6667 |
| Population covariance | =COVARIANCE.P(A2:A5,B2:B5) | 2.75 |
| Correlation | =CORREL(A2:A5,B2:B5) | 0.8315 |
Use COVARIANCE.S when estimating covariance from a sample and COVARIANCE.P when describing population covariance. Microsoft also supports the older COVAR function, although the newer functions have clearer names.
For official instructions, see Microsoft’s COVARIANCE.S documentation.
How to Calculate Covariance in Google Sheets
Google Sheets supports similar statistical calculations.
| Calculation | Google Sheets Formula |
| Sample covariance | =COVARIANCE.S(A2:A5,B2:B5) |
| Population covariance | =COVARIANCE.P(A2:A5,B2:B5) |
| Correlation | =CORREL(A2:A5,B2:B5) |
These formulas automatically update when the referenced data change. Google’s COVARIANCE.S documentation explains the sample covariance function.
When using spreadsheets, ensure the two columns contain correctly matched observations. Missing values should be handled consistently to avoid misleading results.
How to Calculate Covariance Using Python
Python is useful when working with larger datasets or repeated statistical calculations.
The NumPy library provides the cov() function.
import numpy as np x = [2, 4, 6, 8]y = [1, 3, 2, 5] sample_cov = np.cov(x, y, ddof=1)[0, 1]population_cov = np.cov(x, y, ddof=0)[0, 1] print(round(sample_cov, 4))print(round(population_cov, 4))
Expected output:
3.66672.75
The ddof=1 setting uses sample covariance, while ddof=0 uses population covariance.
Additional details are available in the official NumPy covariance documentation.
How Is Covariance Used in Finance and Investing?
A covariance calculator is particularly useful in finance because it helps investors understand how different assets’ returns move together. Investors can analyze covariance to evaluate portfolio diversification and estimate risk.
Covariance Between Two Stocks
Suppose an investor wants to compare two stocks. Rather than comparing raw stock prices, the investor generally calculates returns over matching periods.
A basic price-return formula is:
Return = (Current Price − Previous Price) / Previous Price
For dividend-paying investments, total returns should also account for distributions and relevant corporate actions. The paired returns can then be entered into a covariance calculator.
Positive covariance indicates historical same-direction tendencies, while negative covariance indicates opposite-direction tendencies. However, historical relationships may change during periods of market volatility.
Portfolio Risk Example
Consider a hypothetical portfolio:
| Factor | Asset A | Asset B |
| Portfolio weight | 50% | 50% |
| Standard deviation | 10% | 15% |
| Correlation | 0.20 | 0.20 |
Covariance = Correlation × SD(A) × SD(B)
= 0.20 × 0.10 × 0.15
Covariance = 0.003
The two-asset portfolio variance formula is:
σₚ² = wₐ²σₐ² + wᵦ²σᵦ² + 2wₐwᵦCov(A,B)
Using the example:
Portfolio variance = (0.50² × 0.10²) + (0.50² × 0.15²) + (2 × 0.50 × 0.50 × 0.003)
Portfolio variance = 0.009625
Portfolio standard deviation = √0.009625
Portfolio standard deviation ≈ 9.81%
This demonstrates how the relationship between assets influences overall portfolio volatility.
What Is Rolling Covariance?
Rolling covariance measures how the relationship between two variables changes across successive observation periods. For example, an investor might calculate covariance using the latest 30 trading days, then repeat the calculation as new data become available.
Rolling covariance can help monitor changing asset relationships, although shorter windows may produce unstable estimates.
What Is a Covariance Matrix?
A covariance matrix displays the variances and covariances of several variables in a single table.
For the original datasets, the sample covariance matrix is:
| Variable | X | Y |
| X | 6.6667 | 3.6667 |
| Y | 3.6667 | 2.9167 |
The diagonal values represent individual sample variances. The off-diagonal values represent covariance between the variables.
Covariance matrices are used in portfolio optimization, multivariate statistics, principal component analysis, and machine learning.
Common Mistakes When Using a Covariance Calculator
A covariance calculator can produce misleading results when the underlying data are incorrectly prepared.
| Mistake | Why It Matters | Better Approach |
| Wrong formula | Changes covariance | Select sample or population |
| Misaligned observations | Distorts relationships | Match corresponding pairs |
| Confusing covariance and correlation | Misreads strength | Calculate both |
| Inconsistent units | Changes covariance magnitude | Use consistent scales |
| Using stock prices | May reflect common trends | Analyze aligned returns |
| Ignoring outliers | Can distort results | Review extreme values |
| Assuming causation | Leads to unsupported claims | Investigate other factors |
Data Requirements for Accurate Calculations
Before calculating covariance:
- Ensure both datasets contain corresponding numerical observations.
- Use at least two observation pairs for sample covariance.
- Handle missing values consistently.
- Check measurement units and time periods.
- Review extreme observations.
If one variable has zero variance, its covariance with another variable is zero, but Pearson correlation is undefined.
Conclusion
A covariance calculator provides an efficient way to measure how two numerical variables move together. Understanding sample and population covariance, calculating examples manually, and using Excel or Python can help produce more accurate statistical analysis.
Covariance is particularly valuable in finance, economics, and business analytics. However, it should be interpreted alongside correlation, data visualization, and the characteristics of the underlying observations. Using a covariance calculator with correctly prepared data helps users make better-informed statistical comparisons.
Covariance Calculator FAQs
1. What is the difference between sample and population covariance?
Sample covariance divides by n − 1, while population covariance divides by n. The correct method depends on whether the observations represent a sample or the complete population.
2. Can a covariance calculator handle negative numbers?
Yes. A covariance calculator can process negative values, positive values, and decimals, provided the observations are correctly paired.
3. Can covariance be greater than 1?
Yes. Covariance has no fixed numerical range. Unlike correlation, covariance can exceed 1 or fall below −1.
4. How do I calculate covariance in Excel?
Use =COVARIANCE.S(A2:A5,B2:B5) for sample covariance or =COVARIANCE.P(A2:A5,B2:B5) for population covarianc e.

Source: Cosmo Politian